Study Population
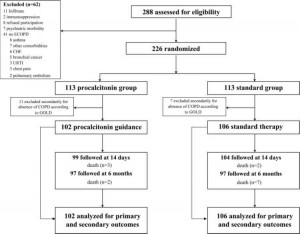
From November 2003 to March 2005, 288 patients with suspected COPD exacerbations were admitted to the emergency department (Fig 1). Of the 226 randomly assigned patients, 18 were removed because they failed to meet spirometric criteria for the presence of COPD. No patient dropped out thereafter, and no patient was lost to follow-up.
Baseline characteristics of the patients in both groups were much the same (Table 1). Current use of antibiotic therapy for exacerbations of COPD was reported by 45 patients (22%), with equal distribution in both groups (p = 0.753).
Overall, cultures from sputum yielded pathogenic bacteria in 37 and 40 patients (36% and 38%, respectively; p = 0.886). Gram-negative bacteria accounted for 69% of all microorganisms recovered (53 organisms), and Gram-positive organisms accounted for 31% of all microorganisms recovered (24 organisms). The most frequently isolated organisms were Enterobacteriaceae spp (18 organisms) and Streptococcus pneumoniae (14 organisms).
The following medications were prescribed for the treatment of the exacerbation: enteral and/or parenteral steroids (88%; procalcitonin group, 89%; stan-dard-therapy group, 93%; p = 0.196); inhaled steroids (91%; procalcitonin group, 93%; standard-therapy group, 89%; p = 0.325); (32-agonist and/or anticholinergic agents (100%; procalcitonin group, 100%; standard-therapy group, 100%; p = 1); and theophylline (5%; procalcitonin group, 6%; standard-therapy group, 4%; p = 0.437).
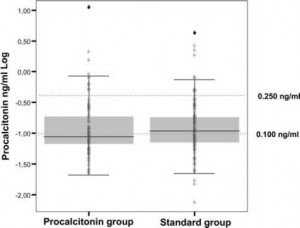
On hospital admission, the median procalcitonin level was 0.096 ng/mL (interquartile range [IQR], 0.070 to 0.200). Figure 2 shows the procalcitonin values measured at admission to the emergency department. Procalcitonin values were 0.25 ng/mL in 41 patients (20%). Procalcitonin levels in patients pretreated with antibiotics were 0.097 ng/mL (IQR, 0.063 to 0.180) compared to 0.096 ng/mL (IQR, 0.070 to 0.21) in antibiotic-naive patients (p = 0.601).

Primary Outcome
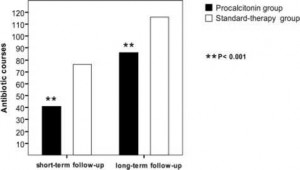
At the index exacerbation, procalcitonin guidance significantly reduced antibiotic prescriptions (40% vs 72%, respectively; p < 0.0001) and antibiotic exposure (RR, 0.56; 95% CI, 0.43 to 0.73; p < 0.0001), compared to standard therapy (Fig 3). The reduction in RR of antibiotic exposure for patients in the procalcitonin group was 44% (95% Cl, 0.27 to 0.57; p < 0.0001), and the absolute risk reduction was 31.5% (95% CI, 18.7 to 44.3%; p < 0.0001). Subsequent antibiotic use for the treatment of exacerbations of COPD within 6 months did not differ between the two groups (46 vs 43 courses, respectively; p = 0.290). Accordingly, procalcitonin-guided antibiotic therapy at the index exacerbation allowed a significant sustained reduction in total antibiotic exposure for up to 6 months (RR, 0.76; 95% CI, 0.64 to 0.92; p = 0.004). There was no difference in the mean (± SD) time to the next exacerbation treated with antibiotics in the procalcitonin and standard-therapy groups (76.7 ± 49.6 vs 76.1 ± 50.9 days, respectively; p = 0.819).
The antibiotics that were prescribed included aminopenicillins (62%), fluoroquinolones (16%), cephalosporins (11%), macrolides (8%), antipseudo-monal penicillins (2%) and other agents (1%). A single antibiotic was used in 94 patients (80%; procalcitonin group, 83%; standard-therapy group, 68%; p = 0.124), two antibiotic agents were used in 20 patients (17%; procalcitonin group, 15%; stan-dard-therapy group, 29%; p = 0.112), and three antibiotic agents were used in 3 patients (3%; procalcitonin group, 2%; standard-therapy group, 3%; p = 1).
Overall, pneumonia developed in 10 patients during the course of the index exacerbation; 5 patients had continued to receive antibiotic therapy since hospital admission (procalcitonin group, 2 patients; standard-therapy group, 3 patients; p = 1.0), and 5 patients had not received antibiotic therapy (procalcitonin group, 4 patients; standard-therapy group, 1 patient; p = 0.205). Two additional patients received antibiotic therapy due to clinical failure (procalcitonin group, one patient; standard-therapy group, one patient; p = 1.0). One patient in the standard-ther-apy group was treated with antibiotics by the family physician immediately after hospital discharge.
Secondary Outcome
In both groups, clinical and laboratory measures of outcome were similar at baseline, at short-term follow-up, and at long term follow-up (Table 2, 3).
Procalcitonin-guided therapy and standard therapy were equivalent in terms of clinical success rate (82.4% vs 83.9%, respectively; p = 0.853).
 Compared to patients in the standard-therapy group, patients in the procalcitonin group had significantly lower FEV1 at baseline (p = 0.021). However, this difference was no longer present at shortterm and long-term follow-ups (p = 0.521 and 0.366, respectively).
Fourteen patients died during the study period (procalcitonin group, 5 patients [4.9%]; standard-therapy group, 9 patients [8.5%]; p = 0.409). Overall, four patients died of COPD-related respiratory failure and eight patients died of a medical condition other than COPD (myocardial infarction, three patients; bronchial carcinoma, one patient; abdominal sepsis, one patient; gastric bleeding, one patient; aortic aneurysm rupture, one patient; aspiration pneumonia, one patient). In two patients, the cause of death remained unknown.
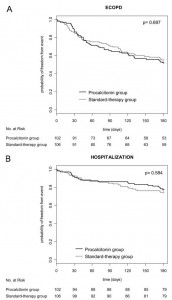
A total of 133 subsequent exacerbations occurred within 6 months of study inclusion (procalcitonin group, 63 exacerbations; standard-therapy group, 71 exacerbations; p = 0.755). Hospitalization for ECOPD was required in 46 cases (21 vs 25 cases, respectively; p = 0.564). There were no significant differences in the exacerbation rate (0.62 vs 0.64, respectively) and the hospitalization rate for exacerbations of COPD (0.21 vs 0.24, respectively) in both groups (Fig 4). The mean time to the next exacerbation was also similar in both groups (70.0 ± 46.1 vs 70.4 ± 51.9 days, respectively; p = 0.523).
Subgroup Analysis
Sputum purulence was noted in 58% of patients (120 patients). In patients with and without sputum purulence, procalcitonin levels were similar (p = 0.287). Positive sputum bacteriology findings were not associated with elevated procalcitonin levels (p = 0.466). According to the classification of Anthonisen et al, procalcitonin levels in patients with type I exacerbations (0.094 ng/mL; IQR, 0.073 to 0.171), type II exacerbations (0.098 ng/mL; IQR, 0.070 to 0.174), and type III exacerbations (0.110 ng/mL; IQR, 0.058 to 0.252) did not differ (p = 0.508). Antibiotic prescription was similar in all exacerbation types, as follows: 59% of patients with type I exacerbations (procalcitonin group, 41%; stan-dard-therapy group, 78%), 54% of patients with type II exacerbations (procalcitonin group, 33%; stan-dard-therapy group, 71%), and 54% of patients with type III exacerbations (procalcitonin group, 44%; standard-therapy group, 62%; procalcitonin group, p = 0.917; standard-therapy group, p = 0.395). Procalcitonin levels on hospital admission correlated significantly with leukocyte counts (R = 0.224; p = 0.001) and C-reactive protein levels (R = 0.377; p < 0.001).
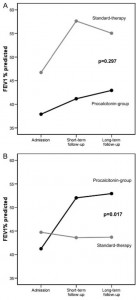
There was no correlation between FEV1 percent predicted and procalcitonin levels on hospital admission (p = 0.895). In patients who were treated without antibiotics, FEV1 improvement did not differ in both groups (p = 0.297) [Fig 5, top, А]. However, patients in the procalcitonin group, who were treated with antibiotics, had greater mean improvements in FEV1 (11.4 ± 23.8%) compared to antibiotic-treated patients in the standard-therapy group (0.72 ± 11.4%; p = 0.017) [Fig 5, bottom, B].
Figure 1. Trial profile. ECOPD = exacerbation of chronic obstructive lung disease; CHF = cardiac heart failure; URTI = upper respiratory tract infection; GOLD = Global Initiative for Chronic Obstructive Lung Disease.
Figure 2. Distribution of procalcitonin levels on admission in 102 patients in the procalcitonin-guided group and 106 patients in the standard-therapy group.
Figure 3. Total number of antibiotic courses at short-term and long-term follow-up in 102 patients in the procalcitonin-guided group and 106 patients in the standard-therapy group.
Figure 4. Top, A: Kaplan-Meier estimates of the probability of remaining relapse-free and alive at 6 months in the procalcitonin-guided group (n = 102) and standard-therapy group (n = 106). Bottom, B: Kaplan-Meier estimates of the probability of remaining free of a relapse of COPD requiring hospitalization and alive at 6 months in the procalcitonin-guided group (n = 102) and standard-therapy group (n = 106).
Figure 5. Top, A: change in FEV1 in patients who have not been treated with antibiotics during the index exacerbation in the procalcitonin-guided group (n = 61) and standard-therapy group (n = 30). p Values compare the change in FEV1 over time between both groups. Bottom, B: change in FEV1 in patients who have been treated with antibiotics during the index exacerbation in the procalcitonin-guided group (n = 41) and standard-therapy group (n = 76). p Values compare the change in FEV1 over time between both groups.
Table 1 Baseline Characteristics of 208 Patients Randomized to the Procalcitonin and Standard-Therapy Groups
| Characteristics | Procalcitonin Group (n = 102) |
Standard-Therapy Group (n = 106) |
p Value |
| Gender | 0.330 | ||
| Male | 50 (49) | 44 (41.5) | |
| Female | 52 (51) | 62 (58.5) | |
| Age, yr | 69.5 (65-77) | 69.5 (64.8-79) | 0.434 |
| Smoking history, pack-yr | 43 (30-58.5) | 50 (30-60) | 0.574 |
| Current smokers | 40 (39.2) | 54 (50.9) | 0.121 |
| Duration of COPD, mo | 128 ± 82 | 123 ± 85 | 0.437 |
| ECOPDs in previous year | 2.4 ± 2.1 | 1.9 ± 1.8 | 0.168 |
| Hospitalization for ECOPD in previous year | 1.1 ± 1.4 | 0.98 ± 1.3 | 0.532 |
| Duration of ECOPD, d | 4 (2.5-7) | 4 (3-7) | 0.189 |
| Cough | 88 (86.3) | 93 (87.7) | 0.754 |
| Increased sputum production | 71 (69.6) | 73 (68.9) | 0.908 |
| Discolored sputum | 61 (59.8) | 59 (55.7) | 0.545 |
| Dyspnea | 95 (93.1) | 98 (92.5) | 0.616 |
| Fever | 43 (42.2) | 42 (39.6) | 0.710 |
| Maintenance therapy at hospital admission | |||
| p2-agonists | 92 (90.2) | 86 (81.1) | 0.063 |
| Anticholinergics | 55 (53.9) | 53 (50.0) | 0.571 |
| Inhaled steroids | 75 (73.5) | 76 (71.7) | 0.767 |
| Oral steroids | 41 (40.2) | 29 (27.4) | 0.050 |
| Theophylline | 15 (14.7) | 10 (9.4) | 0.252 |
| Home oxygen | 21 (20.6) | 13(12.3) | 0.098 |
| Previous therapy with antibiotics at hospital admission | 23 (22.5) | 22 (20.8) | 0.753 |
| Duration, d | 1.3 ± 3.5 | 0.6 ± 1.7 | 0.356 |
| Comorbidities | |||
| Cardiopathy | 42 (41.2) | 49 (46.2) | 0.487 |
| Arterial hypertension | 23 (22.5) | 27 (25.5) | 0.631 |
| Osteoporosis | 17 (16.7) | 9 (8.5) | 0.094 |
| Malignancy | 12 (11.8) | 14(13.2) | 0.835 |
| Diabetes mellitus | 12 (11.8) | 11 (10.4) | 0.827 |
| Renal insufficiency | 5 (4.9) | 12 (11.3) | 0.128 |
| Severity of ECOPD (criteria of Anthonisen et al) | 0.843 | ||
| 1 (increased dyspnea, sputum purulence, and volume) | 51 (50.0) | 49 (46.2) | 0.677 |
| 2 (two of the above) | 24 (23.5) | 28 (26.4) | 0.748 |
| 3 (one of the above and one or more minor findings!) | 27 (26.5) | 29 (27.4) | 1 |
| Severity of COPD | 0.256 | ||
| GOLD stage I (FEV1 ^ 80% predicted) | 6(5.9) | 5 (4.7) | 0.765 |
| GOLD stage II (FEV1 ^ 50 to < 80% predicted) | 15 (14.7) | 25 (23.6) | 0.116 |
| GOLD stage III (FEV1 ^ 30 to < 50% predicted) | 47 (46.1) | 51 (48.1) | 0.783 |
| GOLD stage IV (FEV1 ^ 30% predicted) | 34 (33.3) | 25 (23.6) | 0.127 |
| Heart rate, beats/min | 98 ± 21 | 100 ± 21 | 0.493 |
| BP, mm Hg | |||
| Systolic | 142 ± 23 | 140 ± 26 | 0.558 |
| Diastolic | 86 ± 19 | 84 ± 19 | 0.449 |
| Respiratory rate, breaths/min | 24 (20-28) | 24 (20-28) | 0.540 |
| SaO2{ | 93 (89-95) | 93 (88-95) | 0.426 |
| pH | 7.41 (7.38-7.45) | 7.42 (7.39-7.44) | 0.721 |
| Po2, mm Hg | 61.5 (55.5-69.9) | 60.6 (52.5-71.4) | 0.590 |
| Pco2, mm Hg | 41.1 (37.5-45.7) | 41.3 (37.5-47.3) | 0.844 |
| Leukocyte count, X109 cells/L | 11.7 ± 8.4 | 11.5 ± 4.6 | 0.431 |
| Sputum samples obtained | 61 (59.8) | 54 (50.9) | 0.212 |
| Positive sputum cultures | 37 (36) | 40 (38) | 0.886 |
Table 2 Clinical Outcome Parameters at Short-term Follow-up in Both Randomized Groups
| Outcomes | Procalcitonin Group (n = 102) | Standard Group (n = 106) | p Value |
| Clinical success | 84 (82.4) | 89 (83.9) | 0.853 |
| Hospital stay < 24 h | 22 (21.6) | 24 (22.6) | 0.852 |
| Length of hospital stay, d | 9(1-15) | 10 (1-15) | 0.960 |
| Need for ICU stay | 8 (7.8) | 11 (10.4) | 0.526 |
| Duration of ICU stay, d | 3.3 ± 2.7 | 3.7 ± 2.1 | 0.351 |
| Steroid use (%) | 89 (87.3) | 93 (87.7) | 0.916 |
| Steroid dose, mg | 250 (119-400) | 280 (183-421) | 0.303 |
| ECOPD rate within 6 mo | 44 (43.1) | 43 (40.1) | 0.607 |
| Hospitalization rate for ECOPD within 6 mo | 18(17.7) | 22 (20.8) | 0.507 |
| Death of any cause within 6 mo | 5 (4.9) | 9 (8.5) | 0.409 |
Table 3 Clinical, Laboratory, and Lung Function Parameters on Hospital Admission, and at Short-term and Longterm Follow-up in Both Randomized Groups
| Parameters | Procalcitonin Group (n = 102) | Standard-Therapy Group (n = 106) | p Valuef |
||||
| Hospital Admission (Day 0) | Short-term Follow-up (Days 14-21) | Long-term Follow-up (Day 180) | Hospital Admission (Day 0) | Short-term Follow-up (Day 14-21) | Long-term Follow-up (Day 180) | ||
| Symptom score | 47 ± 14 | 30 ± 16 | 24 ± 16 | 45 ± 16 | 27 ± 16 | 23 ± 15 | 0.394 |
| Functional status | 40 ± 21 | 61 ± 20 | 60 ± 22 | 40 ± 20 | 58 ± 21 | 61 ± 22 | 0.852 |
| FEVj | |||||||
| L | 0.88 ± 0.41 | 1.04 ± 0.48 | 1.07 ± 0.55 | 0.98 ± 0.41 | 1.01 ± 0.57 | 1.11 ± 0.57 | 0.068 |
| % predicted | 38.7 ± 17.7 | 44.1 ± 19.7 | 45.3 ± 24.3 | 43.5 ± 16.4 | 46.4 ± 20.7 | 46.8 ± 20.7 | 0.176 |
| FEV/FVC | 43.8 ± 11.2 | 47.8 ± 14.7 | 48.0 ± 16.1 | 48.2 ± 12.9 | 51.8 ± 14.4 | 50.1 ± 13.5 | 0.215 |
| Procalcitonin level Mg/L | 0.274 ± 1.049 | 0.074 ± 0.196 | 0.069 ± 0.332 | 0.244 ± 0.516 | 0.049 ± 0.096 | 0.047 ± 0.115 | |
| Median (IQR) | 0.087(0.066-0.192) 0.022(0.013-0.057) 0.014(0.010-0.026) 0.111(0.073-0.201) 0.017(0.013-0.042) 0.017(0.011-0.036) | 0.241 | |||||
| CRP level mg/L | 32 ± 42 | 13 ± 20 | 11 ± 25 | 44 ± 55 | 18 ± 27 | 10 ± 21 | |
| Median (IQR) | 16 (5-53) | 5 (2-16) | 2 (1-9) | 22(7-62) | 7 (2-19) | 4 (2-10) | 0.856 |


